
<Aviation Turbulence>
Aviation turbulence in the free atmosphere is a serious concern in the general aviation industry because it frequently causes occupant injuries, flight delays, fuel losses, and damage. Since air transportation industry over the world is invigorated more and more, the investigation and the forecast of the aviation turbulence become more important.
Numerical study on generation mechanisms of aviation turbulence
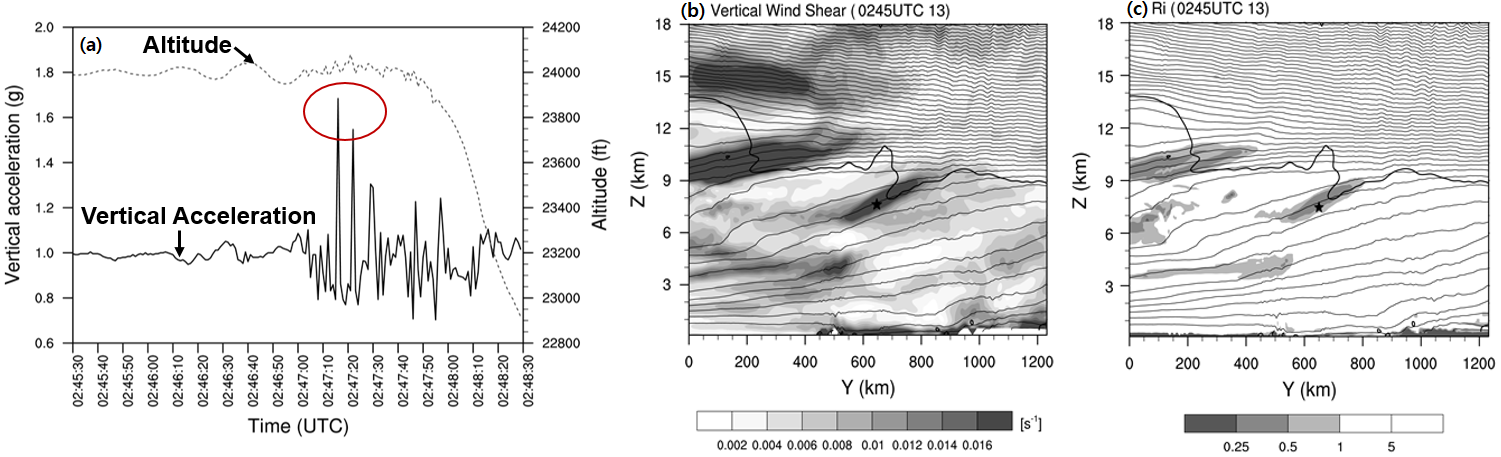
< (a) Vertical acceleration (black line) with flight altitude (gray dashed line) as a function of time obtained from the flight observation data. (b) Vertical cross sections of vertical wind shear and (c) Richardson number (shading) with potential temperature (solid line). >
A study on the generation mechanism of aviation turbulence based on turbulence observation data and high-resolution numerical simulations, which is a one of our researches, is a one of important strategies for escaping the aviation turbulence and preventing an accident risk.
The numerical study can help understanding the characteristic of turbulence and be foundational to developing turbulence diagnostics.The results through this study revealed that mountain-waves, vertical wind shear associated with the jet stream and upper-front system, mountain gravity waves, unbalanced anticyclonic flow and thunderstorms.
The results through this study revealed that mountain-waves, vertical wind shear associated with the jet stream and upper-front system, mountain gravity waves, unbalanced anticyclonic flow and thunderstorms.
Development of Korean aviation Turbulence Guidance (KTG) system
Another avoidance strategy of aviation turbulence is calculating turbulence diagnostics using the numerical weather prediction (NWP) model to estimate aviation turbulence potentials.
Our group developed three types of the Korean Aviation Turbulence Guidance (KTG) systems (KTG, Season-KTG, Korean Peninsula-KTG) through the methodology of the Graphical Turbulence Guidance (GTG) system developed by Sharman et al. using pilot reports (PIREPs) and regional and local NWP models (RDAPS and LDAPS) of Korea Meteorological Administration (KMA).
Performances of the KTG systems are good with AUCs of over 0.8. And the KTG systems are working operationally in the KMA. A global KTG system (G-KTG) based on global NWP model (GDAPS) of KMA and observational data (PIREPs and flight data) is being developed recently.
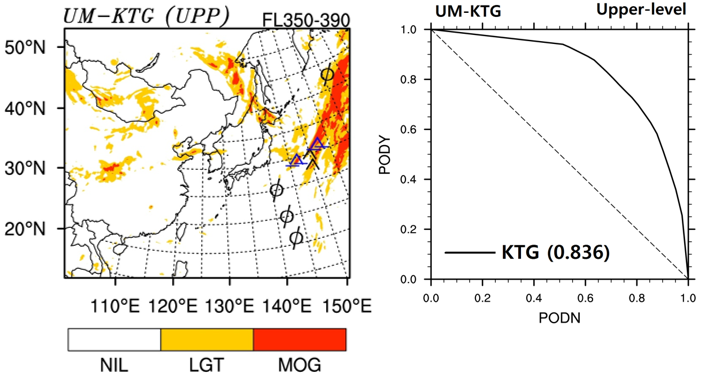
< (a) KTG turbulence forecasting region with PIREPs. (b) PODN-PODY line of the upper-level KTG.>
Aviation turbulence obtained from aircraft observations:
Two in situ turbulence indicators–eddy dissipation rate (EDR) and derived equivalent vertical gust (DEVG) as objective measure–are computed and utilized in statistical analyses and application to validate the current turbulence forecast system (Kim and Chun 2016).
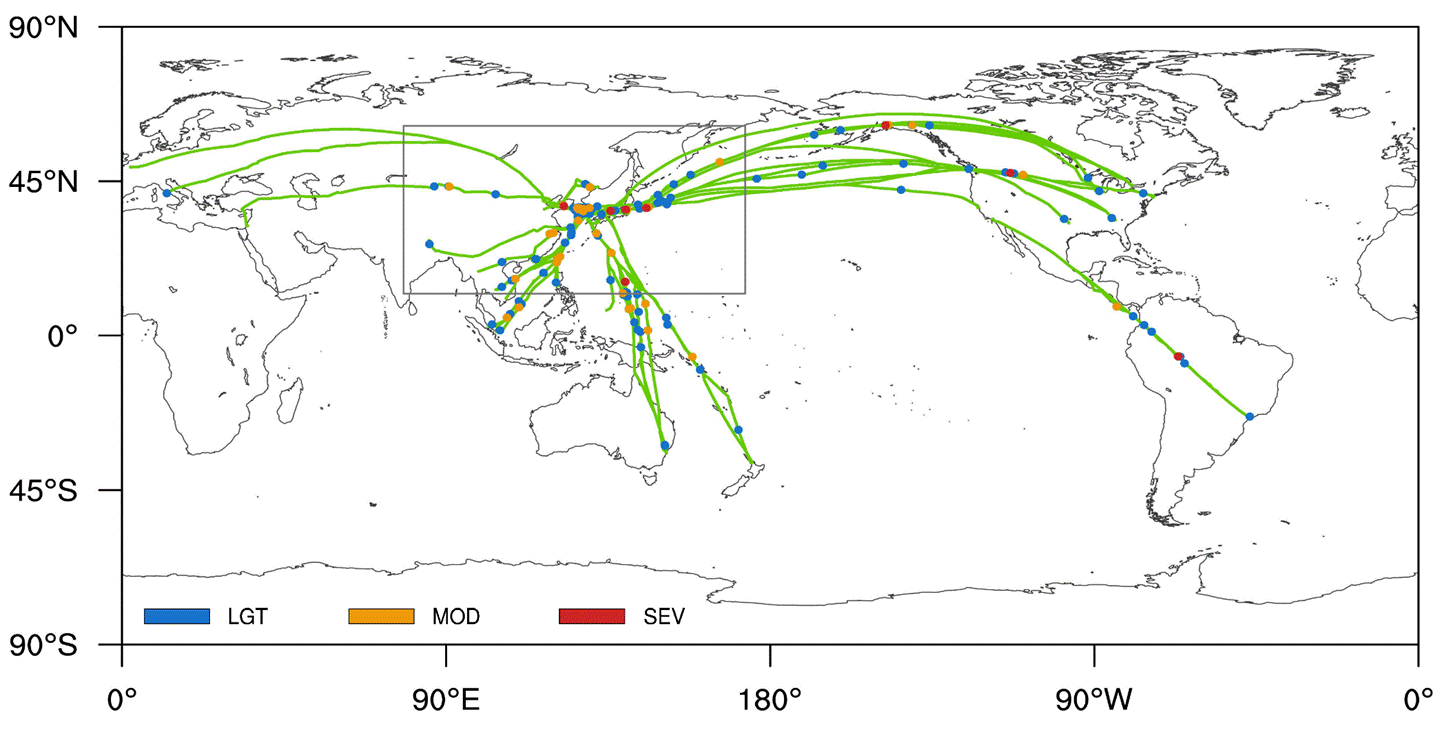
<Flight tracks (solid lines) and locatios (dots) for each intensity of turbulene encounters obtained from Korean Air Lines data>
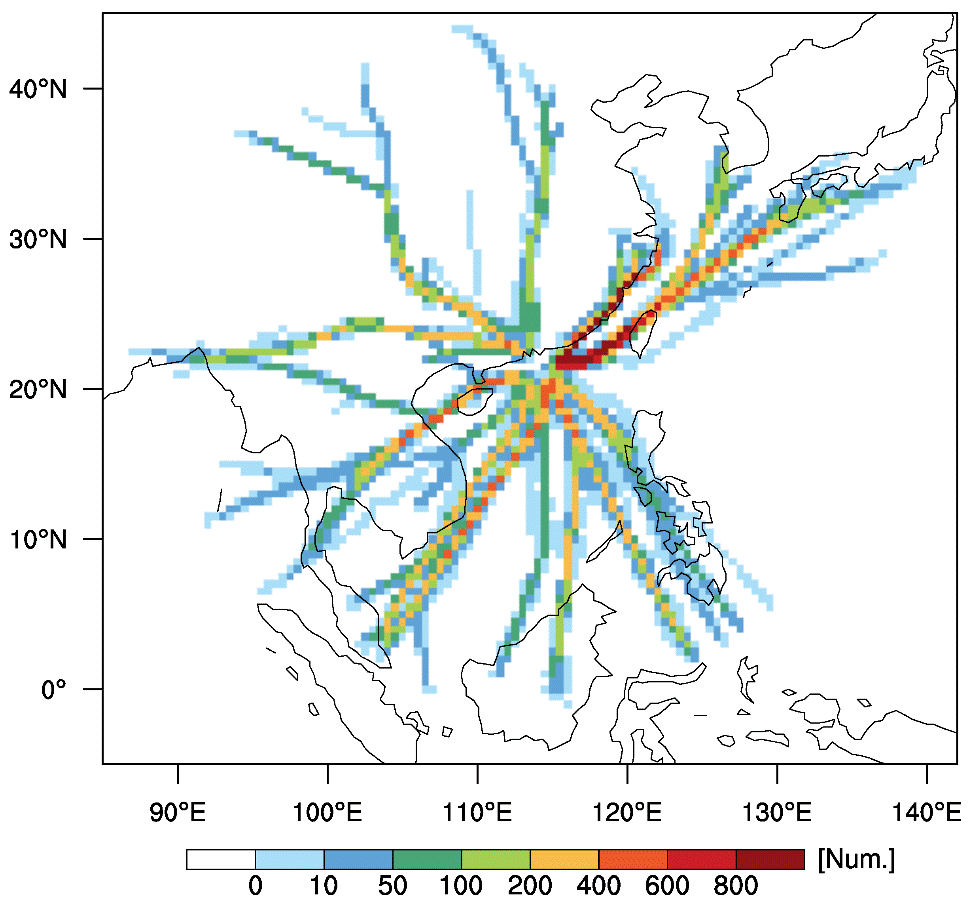
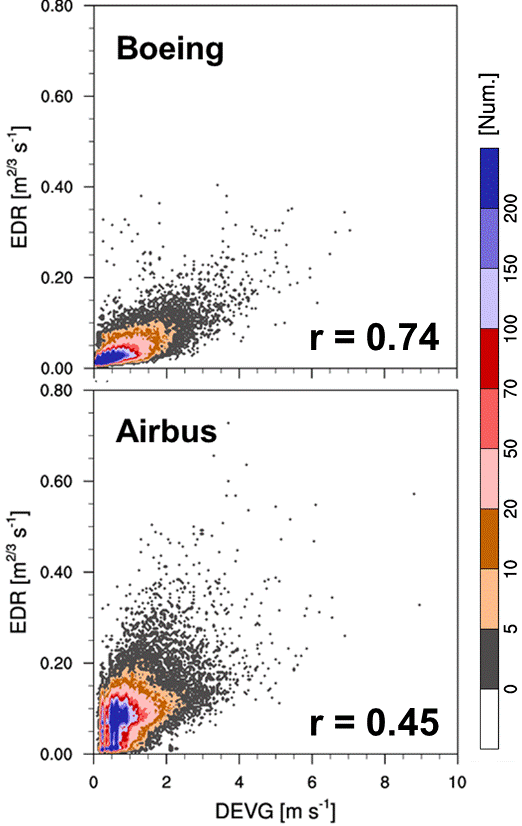
<Flight density of Hong-Kong based airline data> <Scatterplots of EDR and DEVG for Boeing and Airbus aircraft>
From two turbulence indicators (EDR and DEVG) derived from aircraft observations, we investigate the spatiotemporal characteristics of each indicator and compute their correlations. Based on correlation analyses, we construct the best-fit curves between EDR and DEVG for each aircraft type including Boeing and Airbus models (Kim et al. 2017).
Development of near-cloud turbulence diagnostics
We have developed diagnostics of the near-cloud turbulence (NCT) utilizing the parameterization scheme of convective gravity waves (CGWs) proposed by Chun and Baik (1998), used in climate models, in two ways by calculating (i) drag of CGWs and (ii) turbulent kinetic energy (TKE) using the minimum Richardson number including the effect of CGWs. The feasibility of the approaches has been examined based on numerical simulation for the real case associated with an active convection.
[reference]
Chun, H.-Y. and J.-J. Baik, 1998: Momentum flux by thermally induced internal gravity waves and its approximation for large-scale models. J. Atmos. Sci., 55, 3299-3310.
Kim, S.-H., and H.-Y. Chun, 2016: Aviation turbulence encounters detected from aircraft observations: Spatiotemporal characteristics and application to Korean aviation turbulence guidance. Meteor. Appl., 23, 594-604.
Kim, S.-H., H.-Y. Chun, and P. W. Chan, 2017: Comparison of turbulence indicators obtained from in situ flight data. J. Appl. Meteor. Climatol., 56, 1609-1623.
Distribution of Eddy Dissipation Rate Retrieved from High–Resolution Radiosonde Data
Thorpe (1977) proposed very simple method to retrieve turbulence scales in the ocean from in situ measurements. Clayson and Kantha (2008) applied this Thorpe analysis to the atmosphere and retrieved atmospheric turbulence scales from high-resolution radiosonde data.
We used 1–second resolution radiosonde data to retrieve atmospheric turbulence scales, such as Thorpe scale, eddy dissipation rate, and EDR. These radiosonde reach ~30 km altitude and has 5 m resolution vertically, so can resolve the Thorpe scale in the troposphere and lower stratosphere.
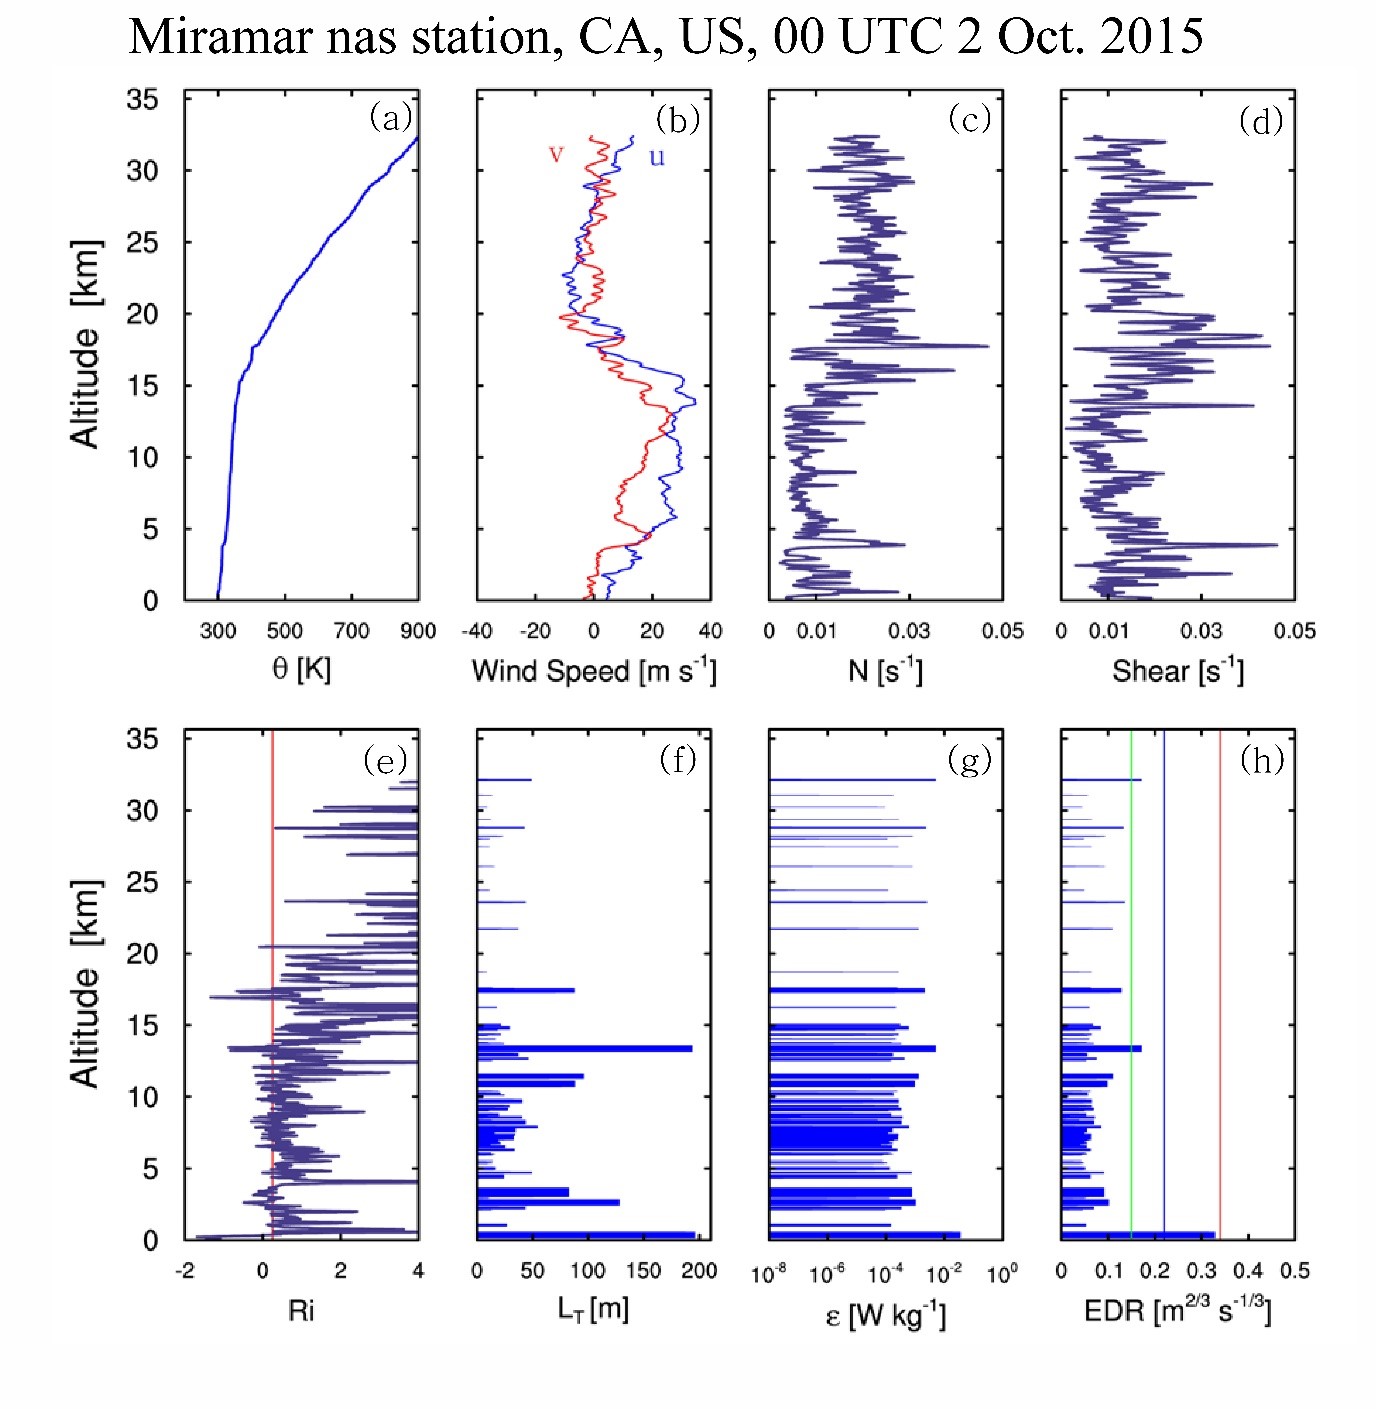
<(a) potential temperature, (b) wind speed, (c) Brunt-Vaisala frequency, (d) vertical wind shear, (e) gradient Richardson number, (f) Thorpe length, (g) eddy dissipation rate, (h) EDR at Miramar nas station, 00 UTC 2 Oct. 2015. The regions where Richardson number < 1/4 are well corresponded to turbulent layers, LT > 0.>