
Convective gravity-wave momentum flux calculated using the GPM satellite data
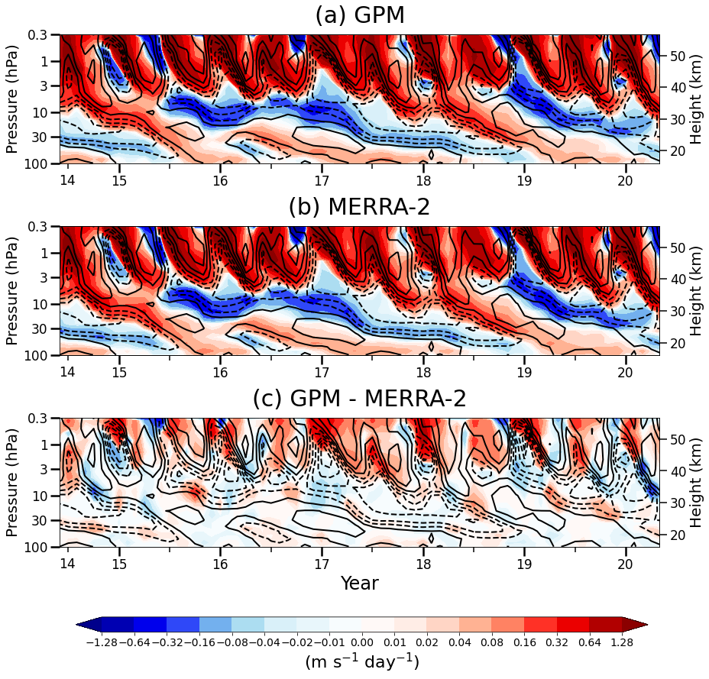
<Time–height cross sections of the convective gravity wave drag (shading) calculated by using (a) GPM and (b) MERRA-2,
(c) difference between (a) and (b) from June 2014 to May 2020>
The above figure shows convective gravity-wave drag (CGWD) averaged between 10°N-10°S calculated using (a) GPM satellite and (b) MERRA-2 data and (c) their differences. A critical-level filtering process mainly induces the CGWD below 40 km, and positive (negative) CGWD is provided in the positive (negative) wind shear zone, contributing greatly to the descent of QBO. Above 40 km, positive CGWD sometimes occurs despite negative wind shear (e.g., May 2016–July 2016), and this is because wave saturation process. At z = 45–50 km, CGWD of GPM is 0.68 m s-1 day-1, and MERRA-2 is 0.61 m s-1 day-1, which is about 11% smaller than GPM. However, there is little difference in CGWD between GPM and MERRA-2 up to the middle stratosphere, and their difference is less than 1%. During 2015/16 and 2019/20 QBO disruption periods, there are little differences in CGWD calculated using cloud information based on GPM and MERRA-2 in the lower and middle stratosphere, and this indicates that CGWD calculated using reanalysis data is also realistic despite the uncertainty of cumulus parameterization in GCM.